Clean Energy Standard vs. Feebate vs. Carbon Tax vs. Cap and Trade

Alan J. Krupnick and Ian W.H. Parry of Resources for the Future have a nice short article on "Decarbonizing the Power Sector: Are Feebates Better than a Clean Energy Standard?" But if the policy goal is to reduce carbon emissions, there are at least four policies in play--all discussed in their article.

  • A clean energy standard. They write: "Under this approach, electricity producers would be required to meet a rising fraction of their generation using zero-carbon sources or sources with lower carbon intensity (defined as CO2 emissions per kilowatt-hour [kWh]) than that of coal generation." In July, the Congressional Budget Office put out a report on "The Effects of Renewable or Clean Electricity Standards:" :
  • A "feebate" system, "which involves fees for [electricity] generators with above-average emissions intensity and subsidies or rebates for those with below-average emissions intensity."
  • A cap-and-trade system, in which the government sets an overall cap on carbon emissions, and then allocates permits to emit this amount of carbon. These emission permits would have two important traits: 1) they would shrink over time, so a permit to emit amount of carbon in one year would gradually phase down to allow emitting only a certain percentage of that amount in future years; and 2) the permits could be bought and sold, so that those who could reduce emissions relatively cheaply would have an incentive to go ahead and do so, and to sell their excess permits to those who would find it more expensive to reduce emissions.
  • A carbon tax.  

I won't attempt to rank these options in any systematic way, but here are some of my thoughts about them.

1) A feebate system has some substantial advantages. Krupnick and Parry explain: "The feebate approach has several potential advantages over a CES [clean energy standard]. For starters, the incremental costs of reducing CO2 are automatically equated across different generators, promoting a cost-effective allocation of emissions reductions within the power sector at a given point in time. Another attraction of the feebate is that it automatically handles changes in the future costs of different generation technologies or fuel prices. If, for example, the future expansion of nuclear power is temporarily held up, firms would be permitted a higher emissions intensity (at the expense of paying more fees or receiving fewer rebates); under a strict CES they would be required to meet a given emissions intensity standard, regardless of costs. Conversely, if the competitiveness of wind power improves, firms are rewarded for exploiting this opportunity and further cutting their emissions under a feebate system; with a CES, they have no incentive to do better than the emissions intensity standard. By establishing a fixed price on CO2 emissions, moreover, a feebate facilitates comparison of policy stringency across countries. This price could be set in line with estimates of the (global) environmental damages from CO2 (currently about $21 per ton, according to a recent review across U.S. agencies and subsequent use in U.S. regulatory impact analyses [U.S. Interagency Working Group on Social Cost of Carbon 2010]) or prices prevailing in the European Union’s Emissions Trading."


2) Anti-tax sentiment is a political constraint. I suspect that the clean energy standard is popular because, at least to politicians, it appears to have no costs. Similarly, cap-and-trade may appear to impose no costs either. In contrast, a carbon tax clearly looks like a charge. A feebate proposal does require collecting revenue and passing it to other actors--but there is no actual revenue retained by the government, so it may not look like a tax

3) The clean energy standard and feebate approaches both focus only on electricity generation, and for that reason would have less effect on carbon emissions than a broader-based cap and trade or carbon tax approach. This may also be a political selling point, because drivers using gasoline and firms that are heavy users of coal or oil or natural gas would be less affected by an approach that focused only on electricity generation. However, the feebate idea might have broader applicability. I have in the past seen feebate proposals in the past that focuses on automobile fuel efficiency: that is, those driving cars with below some level of miles-per-gallon pay a fee, and those driving cars above that level of miles-per-gallon get a rebate.


4) A clean energy standard is a pure regulatory approach, specifying what is "clean" and what is not, and thus is likely to be less effective than a cap-and-trade or a carbon tax approach. Here's how the CBO makes this point in its report: "Even with a wide variety of compliance options, neither an RES [renewable electricity standard] nor a CES [clean electricity standard] would be as cost-effective in cutting CO2 emissions as a “cap-and-trade” program. Such a program would involve setting an overall cap on emissions and letting large sellers of emission-creating products (such as electricity generators, oil producers and importers, and natural gas processors) trade rights to those limited emissions. In that way, a cap-and-trade program would create a direct incentive to cut emissions; in contrast, an RES or CES would create a direct incentive to use more renewable or other types of clean electricity but would have only an indirect effect on emissions."

5) A carbon tax and auctioning of cap-and-trade permits would raise revenue that could be used to lower tax rates in other areas, in ways that could enhance efficiency--but it is difficult to guarantee that the revenues would be used in this way.


6) One great advantage of a carbon tax is that it reduces the incentives for political tinkering. A cap-and-trade proposal, for example, is likely to have extensive grandfathering of those who currently emit carbon, probably along with a parade of special rules and exemptions. Defining what is "clean energy" or even how the feebates would be structured are likely to be more highly political decisions. 


No More Original Sin (in International Finance): Jackson Hole III

This is the third of three posts on some of the papers presented at the Jackson Hole conference held in late August by the Kansas City Fed. The first two posts are here and here. All the papers from the conference are posted here.

Back in the 1999 edition of the Jackson Hole conference, Barry Eichengreen and Ricardo Hausmann presented a paper on "Exchange Rates and Financial Fragility."  In that paper they applied the term "original sin" in this way:

"This is a situation in which the domestic currency cannot be used to borrow abroad or to borrow long term, even domestically. In the presence of this incompleteness, financial fragility is unavoidable because all domestic investments will have either a currency mismatch (projects that generate pesos will be financed with dollars) or a maturity mismatch (long-term projects will be financed with short-term loans). ... Original sin seems to capture a fact about the world. What causes it is an open question. One hypothesis is that a history of inflation and depreciation renders investors reluctant to invest in domestic-currency assets and to invest long term. In fact, however, original sin appears to apply as well to more than a few emerging markets that do not have a recent history of high inflation. Essentially, all non-OECD countries have virtually no external debt denominated in their own
currency."

Original sin was often near the root of international financial crises during the last few decades, because when an emerging market economy had borrowed in another currency, and then its exchange rate fell, the repayment of loans in domestic currency could no longer repay the international debts in the foreign currency. At the most recent Jackson Hole conference, Eswar Prasad points out in "Role Reversal in Global Finance" that emerging economies have now responded to wash their hands of "original sin."

Prasad points out that international financial integration is increasing: "[T]here has been a generalized
increase in de facto financial openness, as measured by the ratio of the sum of gross stocks of external assets and liabilities to GDP. Among advanced economies, the median level of this ratio has more than doubled over the past decade. The increase is large but less spectacular for emerging markets. ... China and India were relatively closed in de facto terms in 2000 but have become much more open since then. Other than Brazil and Russia, which experienced minor dips, virtually every major economy—advanced or emerging—has a higher level of assets and liabilities relative to GDP in 2010 compared to 2007, indicating that the financial crisis did not reverse or stop rising global financial integration. Rising gross external positions have important implications for growth, international risk sharing and financial stability. As gross stocks of external assets and liabilities grow in size, currency volatility will have a larger impact on fluctuations in external wealth and on current account balances."

However, the form of these international assets and liabilities for emerging markets has dramatically changed. Back in the 1980s, the main international liabilities for these economies was debt incurred in foreign currency. But now, the liabilities for countries in emerging market economies have shifted dramatically. Prasad describes a figure this way: "Stocks of foreign direct investment (FDI), portfolio equity (PE) and external debt are shown as ratios of total external liabilities (L). The stock of foreign exchange reserves is shown as a ratio to total external assets (A). ... The weighted mean is the ratio of the sum of external assets and liabilities for all countries in the group expressed as a ratio of the sum
of nominal GDP for all countries in that group."

As the figure shows, there has been a dramatic shift in international liabilities for emerging markets toward foreign direct investment and portfolio equity. On the asset side, there has been a substantial move toward building up foreign exchange reserves, mainly in U.S. dollars. Here's Prasad's figure showing that build-up.

For emerging economies, the risks of international finance have changed quite substantially. With their huge foreign exchange reserves and their lack of borrowing in foreign currencies, they are much better insulated against shocks to their exchange rates than they were in the 1990s. However, instead of having risks on the liability side, from the risk that they would be unable to repay their borrowing in foreign currency, they now face two new risks.

A first risk is that their enormous foreign exchange holdings will be diminished in value, either because of a rise in inflation in the U.S., Europe and Japan which reduces the real value of the debt, or because of a depreciation of the dollar, euro, yen, and pound relative to the currencies of the emerging market economies. As Prasad writes: "As the safety of these assets comes into question, the risk on emerging market balance sheets has now shifted mostly to the asset side. These countries may be forced to rethink the notion of advanced economy sovereign assets as being "safe" assets, although they are certainly highly liquid."

The second risk is that the current inflows of financial capital, in the form of foreign direct investment and portfolio equity, can create problems for domestic markets in emerging countries. Prasad explains: "For emerging markets, the major risks from capital inflows are now less about balance of payments crises arising from dependence on foreign capital than about capital inflows accentuating domestic policy conundrums. For instance, foreign capital inflows can boost domestic credit expansions, a factor that made some emerging markets vulnerable to the aftershocks of the recent crisis. New risks from capital account opening are related to existing sources of domestic instability--rising inequality in wealth and in opportunities for diversification and sharing risk. Capital inflows and the resulting pressure for currency appreciations also have distributional implications as they affect inflation and adversely affect industrial employment growth. The right solution to a lot of these problems involves financial market development, especially a richer set of financial markets that would improve the ability to absorb capital inflows and manage volatility, broader domestic access to the formal financial system (financial inclusion), and improvements in the quality of domestic institutions and governance."


Too Much Debt? Jackson Hole II

This is the second of three posts on some of the papers presented at the Jackson Hole conference held in late August by the Kansas City Fed. The first post is here; the final post will be up later. All the papers from the conference are posted here.

Stephen G. Cecchetti, M. S. Mohanty and Fabrizio Zampolli of the Bank for International Settlements write about "The Real Effects of Debt." They illustrate that a powerful trend during the last few decades toward more debt in a number of high income countries. For example, if one looks at a simple average debt/GDP ratio for 18 OECD economies, including the United States, the combined debt/GDP ratio for government, corporate, and household debt rose from 165% of GDP in 1980 to 310% of GDP in 2010. The biggest increase over this time is debt for the household sector, which tripled in real terms over this period. (Just to be clear, this is non-financial sector debt, so it doesn't count what financial institutions owe to other financial institutions in their role as intermediaries.)

While longer-run data on debt across sector isn't available for all 18 countries that they examine, they offer a longer-run picture of U.S. debt. As they point out, U.S debt tended to hover around 150% of GDP for most of the time until about 1985, when it started rising. (The bump in debt/GDP ratios in the Great Depression, of course, was because the denominator of GDP in that ratio fell so sharply.) Since the 1980s, household debt has been rising faster than private-sector debt.

With these facts in mind, they raise a broader question: "At moderate levels, debt improves welfare and enhances growth. But high levels can be damaging. When does debt go from good to bad?" They use a regression framework that adjusts for many factors and tries to discern threshold effects, which a perfectly reasonable first shot at the issue, although it's the kind of approach that always raises questions about whether the correlation is a causation and whether there are omitted variables. They find:

"Our examination of debt and economic activity in industrial countries leads us to conclude that there is a clear linkage: high debt is bad for growth. When public debt is in a range of 85% of GDP, further increases in debt may begin to have a significant impact on growth: specifically, a further 10 percentage point increase reduces trend growth by more than one tenth of 1 percentage point. For corporate debt, the threshold is slightly lower, closer to 90%, and the impact is roughly half as big. Meanwhile for household debt, our best guess is that there is a threshold at something like 85% of GDP, but the estimate of the impact is extremely imprecise."

The financial crisis of 2007-2009 brought home how easily household borrowing or corporate borrowing, when it goes bad, can turn into government borrowing for bailouts. When thinking about the problems of debt burdens facing the U.S. economy, it seems unwise to look only at government borrowing.


Dani Rodrik on economic convergence: Jackson Hole I

Each year the Kansas City Fed holds a research conference in Jackson Hole in late August that attracts many of the beset and the brightest in the central banking and economic research community. Back in the Paleolithic era, one used to have to wait months until the printed conference volume came out, or try to cadge a copy of working papers from authors. But now, of course, all the papers are posted here. In this post and the next two, I'll hit the high spots of three of the papers that particularly struck me.

Dani Rodrik offers a characteristically interesting reflection on "The Future of Economic Convergence."   He starts with some nice figures to show the convergence that has occurred. The first shows growth trends in the world economy from 1950 to 2008. Rodrik writes:

"The world economy experienced very rapid growth in the decade before the global financial crisis. In fact, once we smooth out the annual variations, growth reached levels that were even higher than those in the immediate aftermath of World War II (Figure 1), which is remarkable in view of the fact that growth in the early 1950s was boosted by reconstruction and recovery from the war.The growth pattern of the world economy since 1950 looks U-shaped: a downward trend from about 1960 until the late 1980s, followed by a strong recovery since then.

What this trend hides, however, is the divergent performance of developed and developing countries. As Figure 2 shows, developed countries have experienced a steady decline in growth since the 1960s, from around 3.5 percent per annum in per capita terms during the 1950s to below 2 percent in the early years of the new millennium. The recent recovery in global growth is due entirely to a remarkable improvement in the performance of the developing parts of the world. Growth in developing countries nearly tripled from around 2 percent per capita in the 1980s to almost 6 percent before the crisis of 2008. It is China (and the rest of developing Asia) that accounts for the bulk of this performance. But high growth in East and Southeast Asia predates the new millennium, and what is especially noteworthy about the recent experience is that Latin America and Africa were, for once, part of the high-growth club. Growth picked up in both regions starting around 1990, and surpassed levels not experienced since the 1960s ..." 


Rodrik then poses the hard question on which he has been gnawing for a few years now: What caused this convergence to occur and can it be relied upon to continue? He points out that the standard story of why convergence has occurred tends to emphasize good economic housekeepings: factors like getting monetary and fiscal policy under control, opening to international trade, improvements in governance, and the spread of global production networks. But he argues that China and other growth successes are hardly bastions of conventional economic wisdom. Rodrik writes:

"China’s policies on property rights, subsidies, finance, the exchange rate and many other areas have so flagrantly departed from the conventional rulebook that if the country were an economic basket case instead of the powerhouse that it has become, it would be almost as easy to account for it. After all, it is not evident that a dictatorship that refuses to even recognize private ownership (until recently), intervenes right and left to create new industries, subsidizes lossmaking state enterprises with abandon, “manipulates” its currency, and is engaged in countless other policy sins would be responsible for history’s most rapid convergence experience. One can make similar statements for Japan, South Korea and Taiwan during their heyday, in view of the rampant government intervention that characterized their experience. As for India, its half-hearted, messy liberalization is hardly the example that multilateral agencies ask other developing countries to emulate. Foreign economists advise India to speed up the pace of liberalization, open its financial system, rein in corruption, and pursue privatization and structural reform with greater vigor. India’s political system meanwhile dithers."
So what explains why convergence starts at certain times, and why it takes hold in certain places but not in other? Rodrik looks at a sectoral level and finds that certain industries, if a country gets a foothold in those industries, seem to experience a rapid convergence to global productivity standards. These industries often involve tradeable manufactured goods, including cars, machinery and equipment, and motorcycles. He presents a striking result that when these industries are established, their tend to converge almost regardless of the government's economic policies--unless those policies are truly terrible.

Rodrik then makes the provocative claim that a difficult issue for many economies is whether they have the flexibility to expand and move labor into these "escalator industries." If labor moves into these industries, overall economic convergence can occur. But in some cases--and he offers examples from Latin America and Africa--rapid productivity growth in one trade-oriented industry has reduced the need for labor in that industry, and thus thrown workers back into lower-productivity industries, a phenomenon he called "growth-reducing structural change."


I'm not always fully convinced by Rodrik's work, but I find it continually intriguing and thought-provoking.


World Economic Forum Ranks U.S. Competitiveness

The World Economic Forum is an independent organization that has been around since the early 1970s. It's perhaps best-known for the annual shindig that it holds in Davos, but the organization also puts out a number of reports on aspects of the global economy. The WEF's 2011-2012 Global Competitiveness Report evaluates 142 countries on more than 100 different indicators.

Here, I focus on the WEF evaluation of the U.S. economy. Overall, the U.S. economy ranks fifth in the WEF's Global Competitiveness Index--behind Switzerland, Singapore, Sweden, and Finland. Clearly this ranking is one of those weighted averages of a lot of stuff, and one can raise questions about the both individual components and weights used. But it's also true that when you look at the indicators as a group, it tells useful story. For the U.S. economy, the story is one of real and deep strengths in areas like the size of its markets, the flexibility of its labor markets, its potential for innovation and technology, the overall competence of business management, and its higher education system. It's also a story of real and deep weaknesses in secondary education, making widespread use of web-based and wireless technologies, and macroeconomic problems of too little saving and too much government borrowing.


Here's the U.S. story in more detail. The WEF groups its 100-plus indicators into 12 "pillars," with the overall U.S. ranking among the 142 countries for that "pillar" shown in parenthesis--and then a few words about the underlying components.

Market size (1st of the 142 countries evaluated)
Many Americans take the benefits of our huge domestic economy for granted, but it allows U.S. firms to take advantage of economies of scale and focus on innovation and productivity. Firms with smaller markets need either to operate at a smaller scale, or else spend the time and money to break into a number of foreign markets.

Labor Market Efficiency (4)
In this category, the U.S. economy gets credit for flexibility in hiring and firing, and for being an economy with relatively little "brain drain"--that is, where highly skilled people want to work. The professionalism of U.S. management also gets some credit.


Innovation (5)
This category emphasizes research institutes, R&D spending, scientists and engineers, patents, and capacity for innovation--all categories where the U.S. ranks among the world leaders.

Business sophistication (10)
This category includes distribution, marketing, quantity and quality of local suppliers, delegating responsibility within firms, and clusters of excellence, where the U.S. economy has considerable strengths.


Higher Education and Training (13) 
From a world point of view, "higher education" includes secondary school--not just colleges and universities. And here we begin to see some hard issues for the U.S. economy.When it comes to college ("tertiary") enrollment, the U.S. does well. But when it comes to secondary education, and quality of math and science education, the U.S. slips way down the rankings.

Infrastructure (16)
The U.S. doesn't do super-well in roads, railroads, ports, or air transport infrastructure. It falls even a little lower in these rankings in the quality of its electricity supply. And the U.S. has been a slow adopter by world standards of mobile phone technology, which is surely one of the technologies with the broadest implications for re-structuring our economic and personal interactions in the years ahead.  

Technological readiness (20)
Color me skeptical on this one. Sure, the U.S. ranks low in "Foreign Direct Investment and Technology Transfer," but given the huge U.S. domestic economy and the fact that it's near the front edge of technology in so many areas, the lower level of getting technology from elsewhere doesn't seem all that worrisome. But this list again emphasize that when it comes to connectivity and the internet, the U.S. is not at the tip-top of the world rankings.


Financial market development (22)
This lower ranking is probably a bit misleading, too. Much of this low ranking is because of difficulties with U.S. banks in the aftermath of the housing price bubble collapse, and is certainly less of a worry in 2011 than it was in early 2009. The same with "ease of access to loans." I haven't dug into the fine print to see how the WEF ranks "regulation of securities exchanges" or "Legal rights index," but these are subjective and potentially controversial. 

Goods market efficiency (24)
The overall ranking here is probably too low, because some of the lower-ranking elements in this category aren't as important in the U.S. economy, with its technological edge and its huge domestic market, as they would be for many other economies: imports/GDP, customs procedures, trade barriers, and foreign ownership. But the rankings are flagging the dysfunctional U.S. tax code, which has too many legal loopholes and as a result ends up imposing higher-than-necessary rates. There are also some strengths in this area, like the degree of local competition and the sophistication of buyers.


Institutions (39)
Almost all of the underlying facts in this "pillar" are based on an Executive Opinion Survey done by the World Economic Forum. Thus, the rankings are based on the opinions of that group. This approach is fraught with difficulties: business people are being asked about their own countries, and so comparisons across countries are tricky. Also, some will use surveys like this to boost their own country or to bash others. Personally, I'm not so sure that a business community which is critical of its politicians is such a bad thing. I'd worry a bit if the business community felt too cozy with the government! But for what it's worth, here's the breakdown.


Health and primary education (42)
Again, I mistrust some of these rankings of effects of disease because they measure responses of executives on a survey about how these will affect their company, not actual measures of costs. thus, for example, a country in which business executives worry more about the impact of HIV/AIDS shows up here with a lower ranking. But these rankings also show some well-known difficulties of the U.S. in terms of infant mortality, life expectancy, and even primary education.   


Macroeconomic environment (90)This ranking is based on the very low level of U.S. savings, compared with the enormous budget deficits and high levels of accumulated government debt. Oddly enough, what saves this ranking from being even worse is that the U.S. still ranked 9th best in the world for "credit rating" at the time these rankings were done. One suspects that particular ranking won't last.


Overall, here's the two-paragraph summary about the U.S. economy from the WEF report:

"The United States continues the decline that began three years ago, falling one more position to 5th place. While many structural features continue to make its economy extremely productive, a number of escalating weaknesses have lowered the US ranking in recent years. US companies are highly sophisticated and innovative, supported by an excellent university system that collaborates admirably with the business sector in R&D. Combined with flexible labor markets and the scale opportunities afforded by the sheer size of its domestic economy—the largest in the world by far—these qualities continue to make the United States very competitive. On the other hand, there are some weaknesses in particular areas that have deepened since past assessments. The business community continues to
be critical toward public and private institutions (39th). In particular, its trust in politicians is not strong (50th), it remains concerned about the government’s ability to maintain arms-length relationships with the private sector (50th), and it considers that the government spends its resources relatively wastefully (66th). In comparison with last year, policymaking is assessed as less transparent
(50th) and regulation as more burdensome (58th).

A lack of macroeconomic stability continues to be the United States’ greatest area of weakness (90th). Over the past decade, the country has been running repeated fiscal deficits, leading to burgeoning levels of public indebtedness that are likely to weigh heavily on the country’s future growth. On a more positive note, after having declined for two years in a row, measures
of financial market development are showing a hesitant recovery, improving from 31st last year to 22nd overall this year in that pillar."

I've noted some of my qualms about this index. But taken as a whole, this seems to me a fair-minded broad sketch of the strengths and weaknesses of the U.S. economic situation.


Narayana Kocherlakota on Rigidities, Adjustments, and Monetary Oolicy

Narayana Kocherlakota writes on "Labor Markets and Monetary Policy" in the 2010 Annual Report of the Minneapolis Fed.

Monetary policy can address nominal rigidities, but should not seek to overcome standard economic adjustments
"Suppose that the cost of energy rises suddenly. This increase influences the economy through rather standard demand-and-supply forces. With higher input costs, firms cut back on production and demand less labor, creating higher unemployment. The first lesson from the modern macroeconomic research is that trying to use monetary policy to eliminate this increase in unemployment, generated by the firms’ natural market response to changes in input costs, leads to rates of inflation that are too high relative to the Federal Reserve’s price stability mandate.
     But the modern macroeconomic research also emphasizes that this standard demand-and-supply story captures only part of the effects of the energy price shock. Implicitly, the standard story assumes that the fall in labor demand triggers an immediate fall in wages. This assumption is contradicted by considerable evidence that firms are often unwilling to cut wages by much in response to shocks. Since wages don’t fall sufficiently quickly in response to the change in energy prices, firms cut back even more on labor, and unemployment is even higher than would be implied by the standard demand-and-supply story.
     The second lesson from the modern macroeconomic research is that accommodative monetary policy can offset this additional increase in unemployment, caused by sluggish wage adjustment, without generating unduly high inflation. Intuitively, the additional increase in unemployment occurs only because of the downward pressure on wages, which eventually manifests itself as downward pressure on prices of goods. Accommodative monetary policy is able to offset this increase in unemployment and keep inflation from being too low.
     This story about the consequences of a change in energy prices is only an example, but its lessons apply much more generally. The impact of any macroeconomic shock can be divided into two components. One component is the effect of the natural demand and supply adjustments that would occur if prices and their expectations were to adjust continuously. Monetary policy cannot be used to offset this natural consequence of the shock without creating inflation that is either too high or too low. The other component is the consequence of what economists call nominal rigidities—the sluggish adjustment of prices (including wages, the price of labor) and price expectations. Monetary policy can be used to offset this latter component of the shock’s impact without creating undue pressures on inflation. The challenge for monetary policymakers is to figure out how to divide the observed movements in the unemployment rate into these two components."
Core inflation is more informative than labor market data in setting monetary policy
"Is the unemployment rate high because of nominal rigidities, or is it high because of other factors? That is a central question that confronts monetary policymakers seeking to set the appropriate course of monetary policy. In this essay, I’ve argued that data on aggregate labor market variables like unemployment rates and vacancies are insufficient to reach a sharp answer. Other information, including survey responses and inflation data, suggests that nominal rigidities are having a substantial impact. This conclusion, combined with the low level of inflation itself, implies that it is appropriate for monetary policy to be highly accommodative—as indeed it was at the end of 2010.
     As always, monetary policy will need to evolve in response to ongoing shocks and new information. But I suspect that information about aggregate labor market quantities like unemployment will remain—at best—a noisy indicator about the appropriate stance of policy. Instead, I will be paying close attention to the behavior of core inflation. As the preceding analysis suggests, the changes in this variable appear to provide critical information about the empirical relevance of nominal rigidities, and therefore about the appropriate stance of monetary policy."

In the August meeting of the Open Market Committee, Kocherlakota was one of three dissenters against announcing a policy that near-zero interest rates would continue for the next two years. For my post agreeing with his dissent and laying out how I see the evolution of monetary policy in recent years, see "Can Bernanke Unwind the Fed's Policies?"

Will U.S. Housing Prices Finally Bottom Out in 2012?

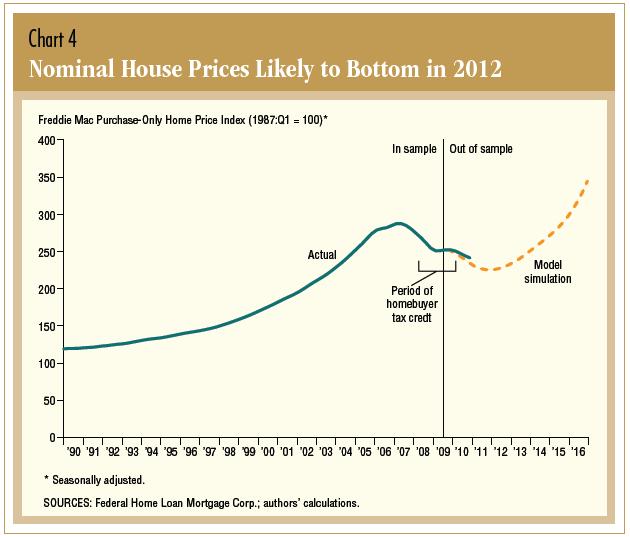
John V. Duca, David Luttrell and Anthony Murphy of the Dallas Fed ask: "When Will the U.S. Housing Market Stabilize?  Their answer, like that of the August CBO report I posted about a few weeks ago, is that housing prices are likely to bottom out in 2012. 

In describing patterns of construction and building permits in recent decades, they write: "During the subprime boom, construction of single-family homes surged to a high of 1.8 million units per year, far above the 1.1 million units required to cover population growth and physical depreciation of structures. Construction then collapsed, falling roughly 75 percent from the peak by mid-2009." As their figure shows, this decline appears to have bottomed out at a level fairly similar to that experienced in the deep recessions of the early 1980s.

They emphasize the role of swings in the loan-to-value ratio: "More people qualified for a mortgage during the so-called subprime boom because lenders eased the minimum down-payment ratios, maximum debt-payment-to-income ratios, minimum credit scores and other criteria. The relaxed credit standards can be seen in a new survey-based data series on the average mortgage-loanto-
house-price ratio, or loan-to-value (LTV) ratio, for first-time homebuyers (Chart 3), or its counterpart, the downpayment ratio. The average, cyclically adjusted LTV ratio rose to as high as
94 percent (that is, a 6 percent down payment) at the height of the subprime boom, before retreating during the bust. The ratio was about 88 percent (12 percent down payment) during the 1990s."

Their simulation results suggest that housing prices will bottom out in late 2011 or 2012. "During the boom and subsequent bust, house prices were affected by unusual factors, including large swings
in mortgage financing standards and tax credits for first-time homebuyers. ... Our econometric models of U.S. house prices, estimated using data through third quarter 2009, take account of these factors, as well as conventional drivers of housing demand. This exercise, carried out in early 2010, predicted
that house prices would resume declining after the expiration of the U.S. tax credit in mid-2010, falling about 5 to 6 percent after third quarter 2010 before likely hitting bottom in late 2011 or early 2012 (Chart 4). ... Since early 2010, our simulation has tracked the actual movement in the Freddie Mac purchase-only home price index."

Copyright © Long Term Payday Loans. All Rights Reserved.
Blogger Template designed by Click Bank Engine.