Showing posts with label market direction. Show all posts

Getting A Hold On Market Weakness

Now that the US markets have been down 3 straight days, I get a lot more queries on "what the hell is happening" ... "is this going to continue" ... Well, first of all, in my lifetime, I have never seen a major correction whilst interest rates are near all time lows, have you??!! We are so used to a robust equity market for the last 12 months, that we lose sight what is a normal dip.

The trouble is exacerbated when fundamentals cannot explain these 3 days of weakness, we go searching for reasons, and usually they are the wrong ones. Some will cite that Obama's health care plan faces a setback with a Republican taking over the late Ted Kennedy's seat... some will say its Obama's thinking of implementing a tax on "traders or firms taking prop positions" ...

The whole thing is further exacerbated by people looking to charts and technicals to explain the situation - this is the best part, when all other reasoning fails, let's look at charts ... well you might as well consult a fengshui master. Charts are not so bad really, they are tools which can help us.

I came across a pretty straight forward guy looking at technicals of emerging markets, pretty OK.
-------------------
Richard Shaw is the managing principal of QVM Group LLC, a fee-based investment advisor based in Connecticut. QVM manages portfolios uniquely designed for each client on a flat fee basis through the client’s own accounts at Schwab, Fidelity or Vanguard.

The BRIC countries are a mixed story. Brazil and China have clearly broken support, while Russia and India are still in rising patterns. Brazil may be a Sell. We think China is a Sell. Brazil has broken three conceptual support levels — its trend line connecting recent bottoms, its 21-day lower price channel and its 100-day moving average (in red). The 200-day average (in blue) is about 15% away.
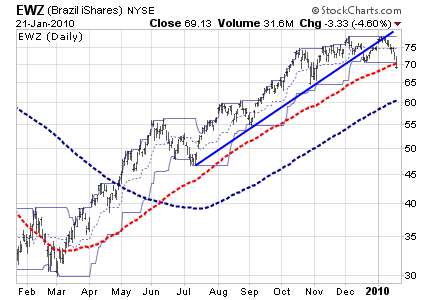
ewz1

As of January 21, China has broken four of four conceptual support levels, including its 200-day moving average, which is generally held to be a major significance.
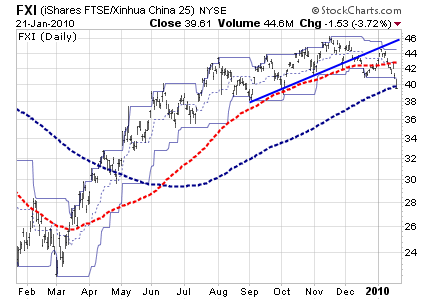
fxi

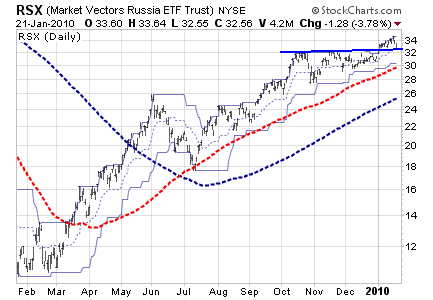
Russia is in a rising pattern, but is testing a support level created by two recent highs that had formerly provided resistance. That support level is above the price channel and moving average support levels.
rsx1

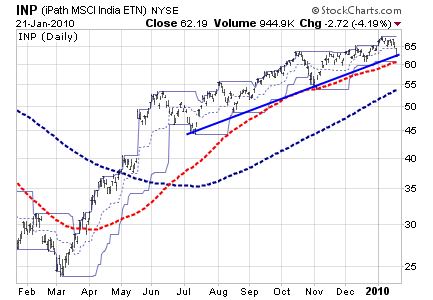
India is still in a rising pattern, but is close to a level where three conceptual supports converge (trend line, lower 21-day price channel and 100-day moving average).
inp

The other countries within the emerging markets index are also a mixed bag.

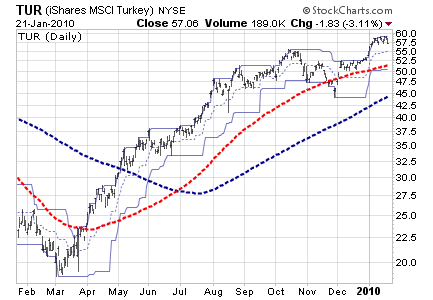
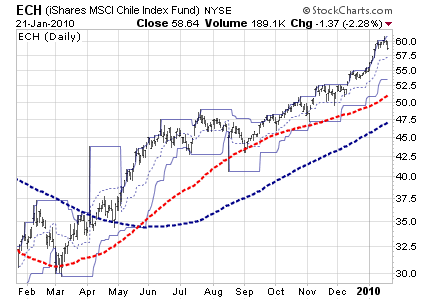
Chile and Turkey are the two with the strongest current price patterns.
ech

tur

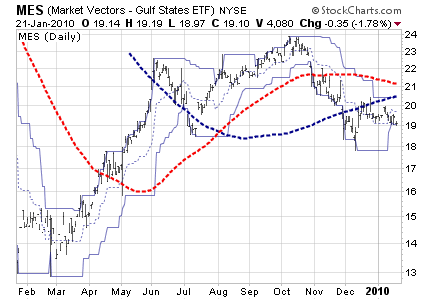
The Middle East has the weakest price pattern.
mes

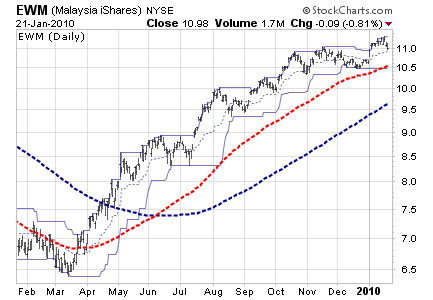
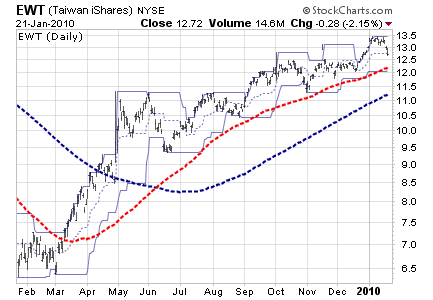
Taiwan and Malaysia are in OK price chart conditions.
ewt

ewm1

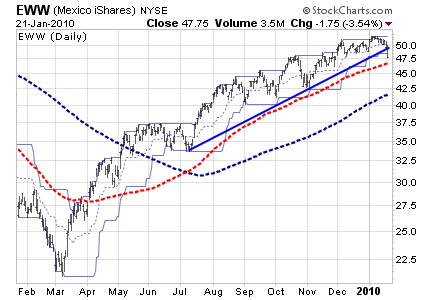
Mexico is still in a rising pattern, but has pierced its bottom connecting trend line and its 21-day lower price channel. The 100-day moving average is not far away.
eww2

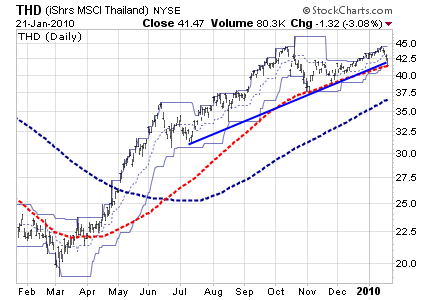
Thailand did not exceed its high achieved in October and is now at critical support formed by the convergence of its trend line connecting bottoms, its 21-day price channel and its 100-day moving average.
thd1

--------------
My concluding view is that we are just in an adjustment mode, I do think the markets will resume its bullishness very soon. I also see some markets drifting away from each other as the domestic liquidity conditions and monetary policies are diverting. Many are trying to rein in excessive lending and excessive property price speculation. I do think Malaysia is less affected by these issues. You should also read the recent posting on PEG ratios to get a better view that not all markets are similar, we are all going up using different routes.

Market Commentary


Just looking at the markets today, some may not know what to make of it. Its like uncertain and the energy is misplaced and incoherent. Looking at the leaders board, Konsort has raced up the volume list, the stock that links it up is Pelikan. They have a mutual substantial shareholder, look it up. There are talks that Pelikan is being planned for a MBO or a private equity buyout (part of the reason why I highlighted it as a buy below RM1.00). Both should be OK for a swift trade. Not encouraged, only for smart and savvy traders who can move in and out quick by looking at volume and trends.

The other thing one can surmise from the gainers is that the realignment caused by the "new" FTSE-KLCI 30 index, which I have highlighted as "very important". The adjustment process favours certain stocks which takes out some of their free float capacity. Hence look for firm support for Tanjong and Commerce.

Some strategic accumulation can be seen in IOI Corp, which looks to me to be a good base building level, or some "substantial shareholder" thinking that this is the "right levels" to accumulate strongly.
Fergetabout UEM Land or Tebrau, never liked their run up as the story is still wishy washy. No follow through, corporate plans all habuk, tarak api punya. I don't like many stocks now as I think markets do look tired, but if you point a gun to my head to force me to buy one stock to hold till rest of they year, I would probably say E&O.


p/s photos: Elanne Kong & Janice Man


Can Asian Markets Continue To Outperform The Rest - Revisited


Asian equity markets have outperformed mature markets in 2009 thanks to continuous foreign institutional investor (FII) inflows amid diminishing risk-aversion among global investors and some signs of green shoots in Asia. As of July 8 2009, MSCI Asia Pacific gained 11.6% ytd with China and Sri Lanka as the best performers, and Australia and New Zealand as the worst performers. Despite impressive improvements, downside risks remain due to bleak corporate earnings outlook, worries over the real economy and revival of any global risk aversion.

Trends
# 2009 MSCI Asia Pacific performance in USD terms: 11.6% ytd as of July 8, up 38.7% during March 2-July 8
# 2009 MSCI Asia performance in USD terms: 11.3% ytd as of July 8, up 38.0% during March 2-July 8
# 2009 MSCI Asia (ex Japan) performance in USD terms: 29.8% ytd as of July 8, up 57.1% during March 2-July 8
# Best performers (ytd as of July 8, 2009): China: 71.5% | Sri Lanka: 56.2% | Indonesia: 53.8% | Taiwan: 47.0% | India: 42.6% | Viet Nam: 41.4%
# Worst performers (ytd as of July 8, 2009): the Philippines: 30.1% | Singapore: 31.0% | Thailand: 29.3% | South Korea: 27.3% | Pakistan: 26.7% | Hong Kong: 23.7% | Malaysia: 21.6% | Japan: 4.9% | Australia: 1.1% | New Zealand: 1.0%
# In 2009: Asia's equity market (ex Japan) have outperformed mature markets, up 29.8% ytd as of July 8 2009, while the S&P 500 Index and the U.S. Dow Jones Industrial Average fell 5.6% and 9.5% respectively during the same period. Continuous FII inflows to Asian equity markets have taken net flows to a positive US$14.4 billion as of June 24 2009, significantly up from US$10.8 billion in H1 and US$9.6 billion in H2 2008.
# Since March 2009, Asian equity markets have witnessed a rally following a surge in U.S. markets and began to benefit from the widening valuation gap on the back of relatively resilient macroeconomic fundamentals. During the March 2- July 8 period, MSCI Asia (ex Japan) rose by 57.1%, significantly higher than the S&P 500 Index and the Dow Jones Industrial Average which gained 25.5% and 20.9% respectively.
# Valuations: Taiwanese shares are the most expensive in the region, 64.6 times reported earnings, followed by New Zealand (38.0x), China (33.1x for A-shares) and South Korea (32.1x). On the other hand, Singapore (12.1x) and Pakistan (9.7x) are cheapest when compared to their regional peers.
# 2008 Review: The peak-to-trough decline in Asian equities in 2008 (more than 70% for some markets) surpassed the 60% fall in local currency terms during the 1998 Asian financial crisis. Sustained outflows from offshore Asian funds took total net redemptions in Jan-Oct 2008 to a record high such that all money that flowed in during 2007 flowed out.
# Market Integration: There is a noticeable upward trend in the Asia-U.S. correlation with the correlation parameter picking up sharply in H2 2008 (peaking during mid-Oct 2008). However, average correlations for emerging Asian equity markets are generally higher between the region's markets than with U.S. markets.
# Government intervention: Several countries including Taiwan, Pakistan, Vietnam, Thailand intervened in the stock market by narrowing the trading band, introducing stabilization fund to contain volatility, banning short-selling, directing government funds to buy share.

Outlook
# Upsides: AXJ region is now attractively valued, and buying into most of the region's equity markets seems a better bet than bonds amid increasing bond issuance. Also, as of end April 2009, market capitalization of Asian Pacific markets ($10.2tn) has come ahead of that of European markets ($9.3tn, including Africa and the Middle East) as Asian stock prices sour at a faster pace than European ones.
# Downsides: Goomy earnings forecasts, worries over the U.S. economy, exit by local investors and also FIIs alarmed at greater than expected impact of global slowdown on Asia's growth, exports, fiscal deficits, slowing consumer spending and investment may have negative impacts. Investors may move money to bond markets from equity markets in an anticipation of slower global economy's recovery due to the spread of swine flu. High (external) debt exposure of corporate sector in some countries and risks of real estate correction and bank profitability are additional risks.
# Given decreasing inflationary pressures and relatively healthy fiscal positions, further fiscal and monetary stimulus policies by Asian governments will able to boost the region's equity markets in H2 2009.
# Prospects for further inflows into Asian equities remain substantial, as global portfolio continue to adjust from relatively underweight positions, and given cheap equity valuations relative to bonds.
# Asian stocks have yet to reflect expectations for a powerful, synchronized recovery in the global economy as markets are still bearish on global growth and on emerging markets growth.
# Markets would likely grind higher first, before dropping by 20-30%: Catalysts for a correction are (1) flattening improvements in second derivatives; (2) softer than expected data coming out of China and; (3) a US% rally, which takes liquidity out of Asia ex.
# The recent rally in Asian equity markets might not continue due to still-weak real economic condition in many countries and the region's ultimate reliance on exports to the U.S. and EU, which means that financial-investor sentiment will remain susceptible to economic setbacks in those markets.


p/s photos: Meisa Kuroki

Where Are We In This Stock Market Rebound? - Deflation Or Reflation Trades


The key historical lesson from past U.S. recessions and severe bear markets is that the stock market tends to bottom out three to six months before the economic contraction reaches its maximum. From the recent economic figures, it is plausible that the U.S. stock market is possibly at a stage where the recession is passing its worst phase. If history is any guide, the stock market should have entered a bottoming process a few weeks back.

Cyclically-sensitive sectors and markets have outperformed as shown in my recent posts, which further signals that reflation trades could soon make a comeback. For instance, emerging markets have continued to outperform the global average. Early cyclicals, such as consumer discretionary and technology sectors, are also beginning to outperform the broad benchmark
equity index.

Finally, it seems that some segments of global financial markets are repositioning themselves for reflation trades. Commodity currencies have experienced a sharp rebound in tandem with the broad commodity price index as well as the crude oil market. In recent history, these moves have been a harbinger of a more broad-based return of the reflation trades.

The key point here is that the decline in stock prices has been the worst since the Great Depression, and has gone a long way to discounting a severe economic recession and financial fallout. Of course, at previous major bear market lows, valuations have been much better than today’s level so it is open to debate whether the worst is discounted – but we should not ignore that reflation this time around is much bigger than ever before, so P/E multiples may not need to go significantly lower than where they stand today. Monetary authorities and governments around the world are getting increasingly aggressive in combating the financial and economic hurricane, all of which means that deflation trades are very late.

The risk-reward tradeoff suggests that going forward, deflation trades are unlikely to reward investors and they should raise their exposure to stocks at the expense of bonds. All that points to a more stable market DESPITE the recent run up. It looks more solid than what I thought it was a few weeks back. A few weeks back, I tended to think it was a bull run with a chance for a 10% correction. But I have shied away from that conclusion, I do think there will be bouts of soft selling which will then attract fresh funds to reposition before launching up the next level. I see the Dow testing 9,300 sometime this year and holding. For KLCI I think 1,140 is possible.


p/s photos: Zhang Xin Yu

Where Are We In This Financial Crisis & Recovery?


Where are we in the global crisis? Are we recovering yet? Why are stock prices rushing upwards when the real economy still looked unsettled? I have tried to convey some answers in my posts before. Let's look at some more related factors:

a) economic statistics - no doubt the stats that have been coming out are still bad, but we have to remember that economic stats are dated, things that are dated means we all should know already, they do not tell us something we don't already know, we went through it, we read about how many companies have been downsizing, we read about plunging commodity price and the Baltic Dry Index, we hear about the number of foreclosed homes ... hence the main aim when looking at economic stats now is to look for signs of recovery, then we have to distinguish between year on year, quarter on quarter and month on month data, year on year is the hardest to calibrate - we already know that things will be very bad on a yoy basis, thus we look at comparative yoy figure for the past few months, yoy figures are important in that it takes out seasonal effects - its the same month as last year, month on month is deceptive because of seasonal effects e.g. figures for February (Chinese New Year effect / holidays / front loading) when compared to March will have the seasonal effect, which is why it is safer to look at quarter on quarter as it would indicate a more genuine trend change ... considering where we are in the recession cycle, everyone should be looking at the rate of decline, or rather the changes to the rate of decline to get at hints of recovery

b) bad news discounted - just how much of the bad news has been discounted, we can only guess, but when you take into consideration the spike in risk aversion over the last 7 months (which can be measured), it is reasonable to assume that prices have more than discounted the bad news because a depletion of confidence and a spike in risk aversion will lead to oversold markets, and thats where we are coming back from, an oversold position

c) bear market rally - in the beginning I would call it a bear market rally, but since February I think its a cyclical market rally, many who call this a bear market rally are those who totally missed out profiting from the rally, the more it rallies, the louder will those who did not buy will shout that it is a bear market rally ... you will also notice that those fundamentals driven experts have gone a lot quieter in recent weeks as the markets continued to climb because they have been wrong and wrong week in week out, hence the only people still shouting are technical analysts, or rather those chartists who also failed to spot the rising trend are now calling for a massive correction ... nobody wants to be wrong and at the same time not being able to make some money when others have traded profitably, beware of the underlying reasons why some people are saying certain things

d) what could go wrong - markets will seize up again if there are major unknowns appearing again, such as if a few big banks were to collapse, or that some of them would require another bailout in the hundreds of billions again, that is not likely after the "stress test" that did not please many people, to me its a very good move by Geithner because it opens up the books and sores for all to see, only with another round of panic will the bond markets seize up, and when they do, the risk aversion will return, looking at what has transpired, that risk has be lowered significantly

So, yes, foreclosures will be bad, unemployment may still rise ( I expect them to peak by end of June/July 2009), pockets of Europe will still be very bad, but the focus has shifted to investors looking for signs of recovery, and every time economic stats DOES NOT say that, markets will just drift lower, but not correct massively, as the amount of liquidity and the need to have an exposure in order not to miss out, will counterbalance the markets in the weeks and months ahead.


p/s photo: Jessie Chiang
Copyright © Long Term Payday Loans. All Rights Reserved.
Blogger Template designed by Click Bank Engine.